

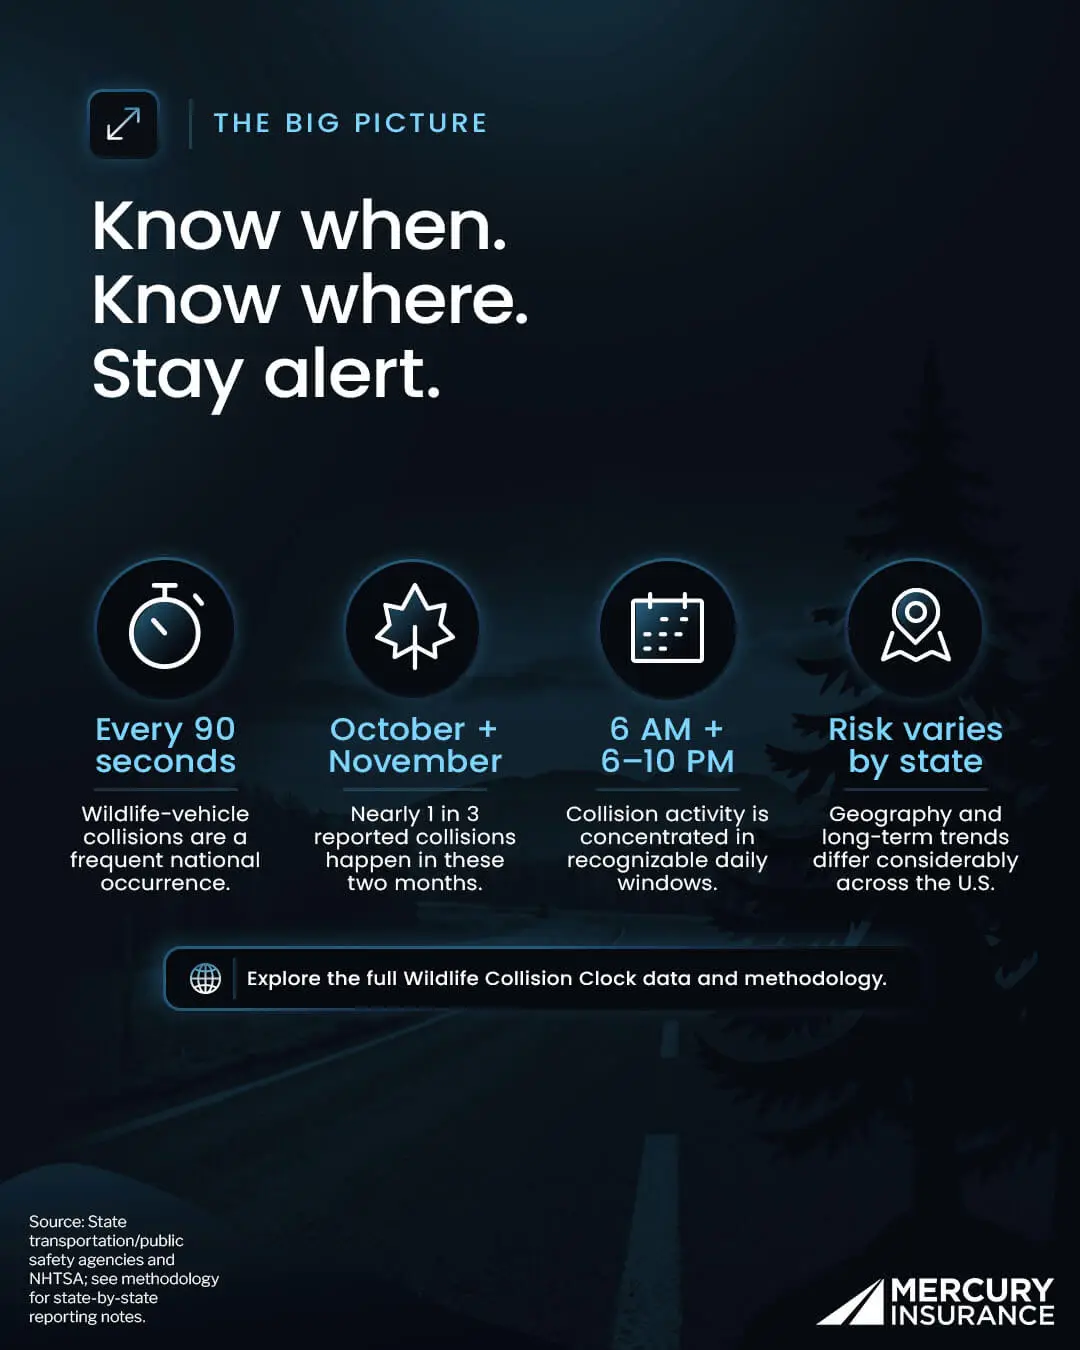
Mercury Insurance’s analysis of state crash data found that a wildlife-vehicle collision is reported every 90 seconds in the U.S., amounting to more than 340,000 reports annually. But the clock does not tick evenly throughout the year or day.
44% of reports occur in the last three months of the year, from October through December. November alone accounts for nearly 1 in 5 reported wildlife-vehicle collisions in the U.S.
Reports reach their highest single-hour share at 6 a.m., when 9% of reported collisions occur. A second, broader concentration spans 6 p.m. to 10 p.m., accounting for another 32% of reports.
The analysis also breaks down the national and state-level patterns behind these peaks and offers practical guidance for drivers, including how insurance typically handles wildlife collisions.
Key Wildlife Collision Statistics
- A wildlife-vehicle collision is reported approximately every 90 seconds in the U.S., totaling more than 340,000 reports annually.
- Reports surge at year-end. October through December account for 44% of reported collisions, with November alone representing 19%. Fall remains the highest-collision season at 40%.
- The 6 a.m. hour has the highest single-hour share of wildlife-vehicle collisions at 9%, while another 32% of reported collisions occur from 6 p.m. to 10 p.m.
- West Virginia, Michigan, South Dakota, Maine and Wyoming report the highest collision totals in the compiled state data. Because reporting definitions vary, these are raw reported counts rather than a standardized ranking of driver risk.
- From 2014 through 2024, Michigan, Tennessee and Virginia recorded the largest average annual increases in fatal wildlife-collision rates. Delaware, New Hampshire and Maine recorded the largest decreases.
How Often Do Wildlife Collisions Happen in the U.S.?
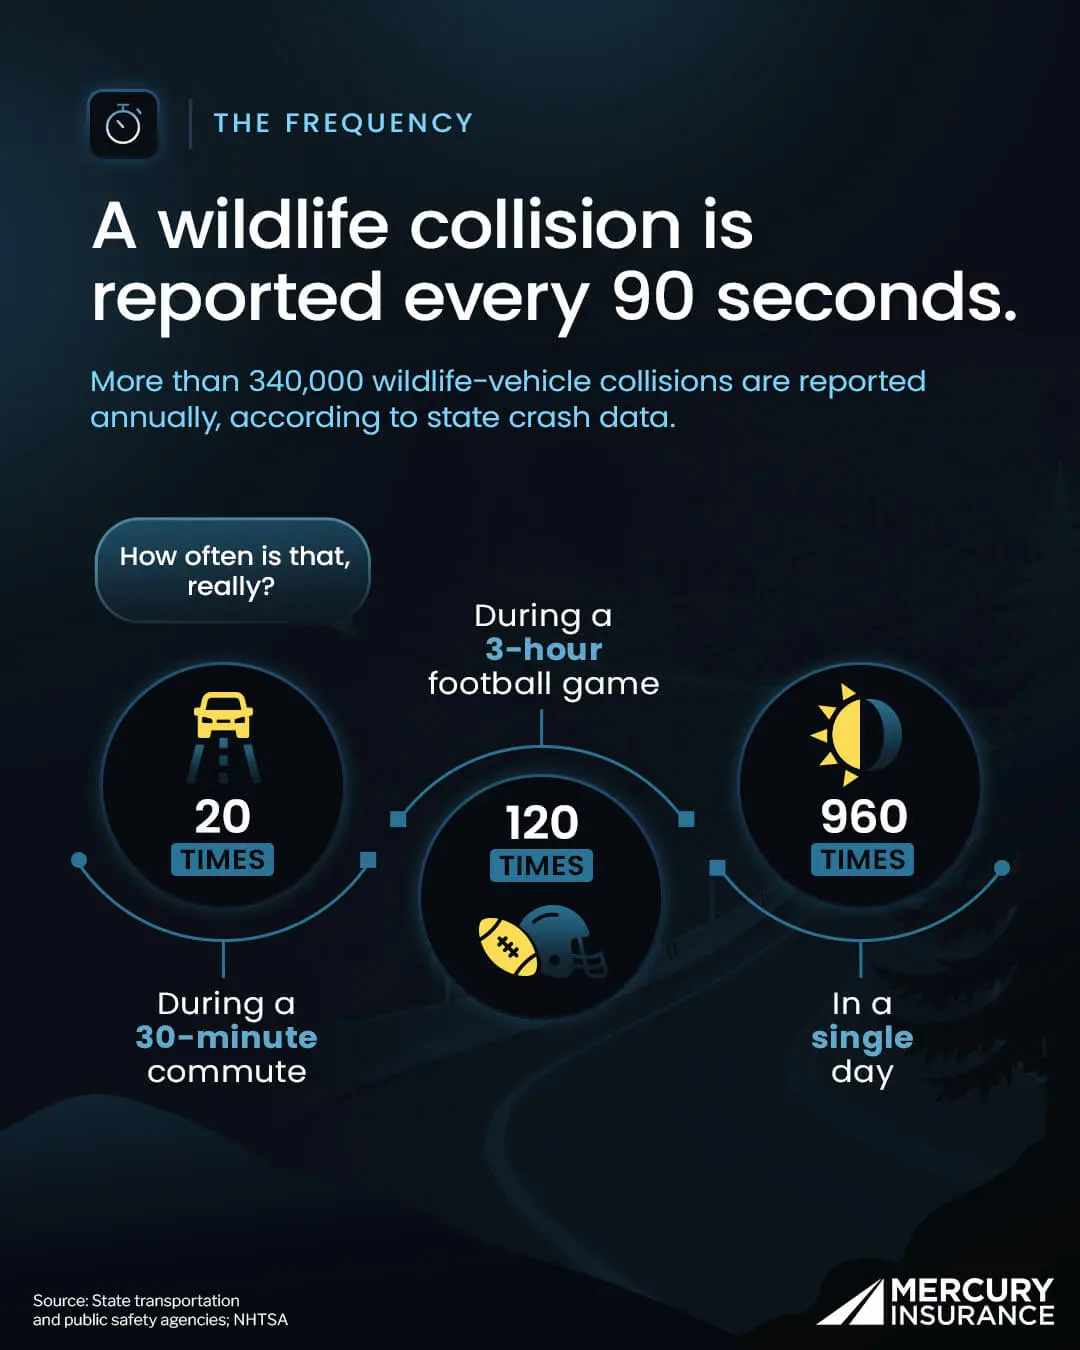
A wildlife-vehicle collision is reported approximately every 90 seconds in the U.S., based on more than 340,000 annual reports in the state datasets reviewed. At that pace, about 20 collisions are reported during a 30-minute commute, 120 during a three-hour football game, and 960 in a single day.
Those figures describe reported incidents, not every collision that occurs. Minor crashes may go unreported, and states differ in which animal-related crashes they record. The national frequency is therefore a practical estimate from the available data rather than a complete census of every wildlife collision.
When Do Wildlife Collisions Surge During the Year?
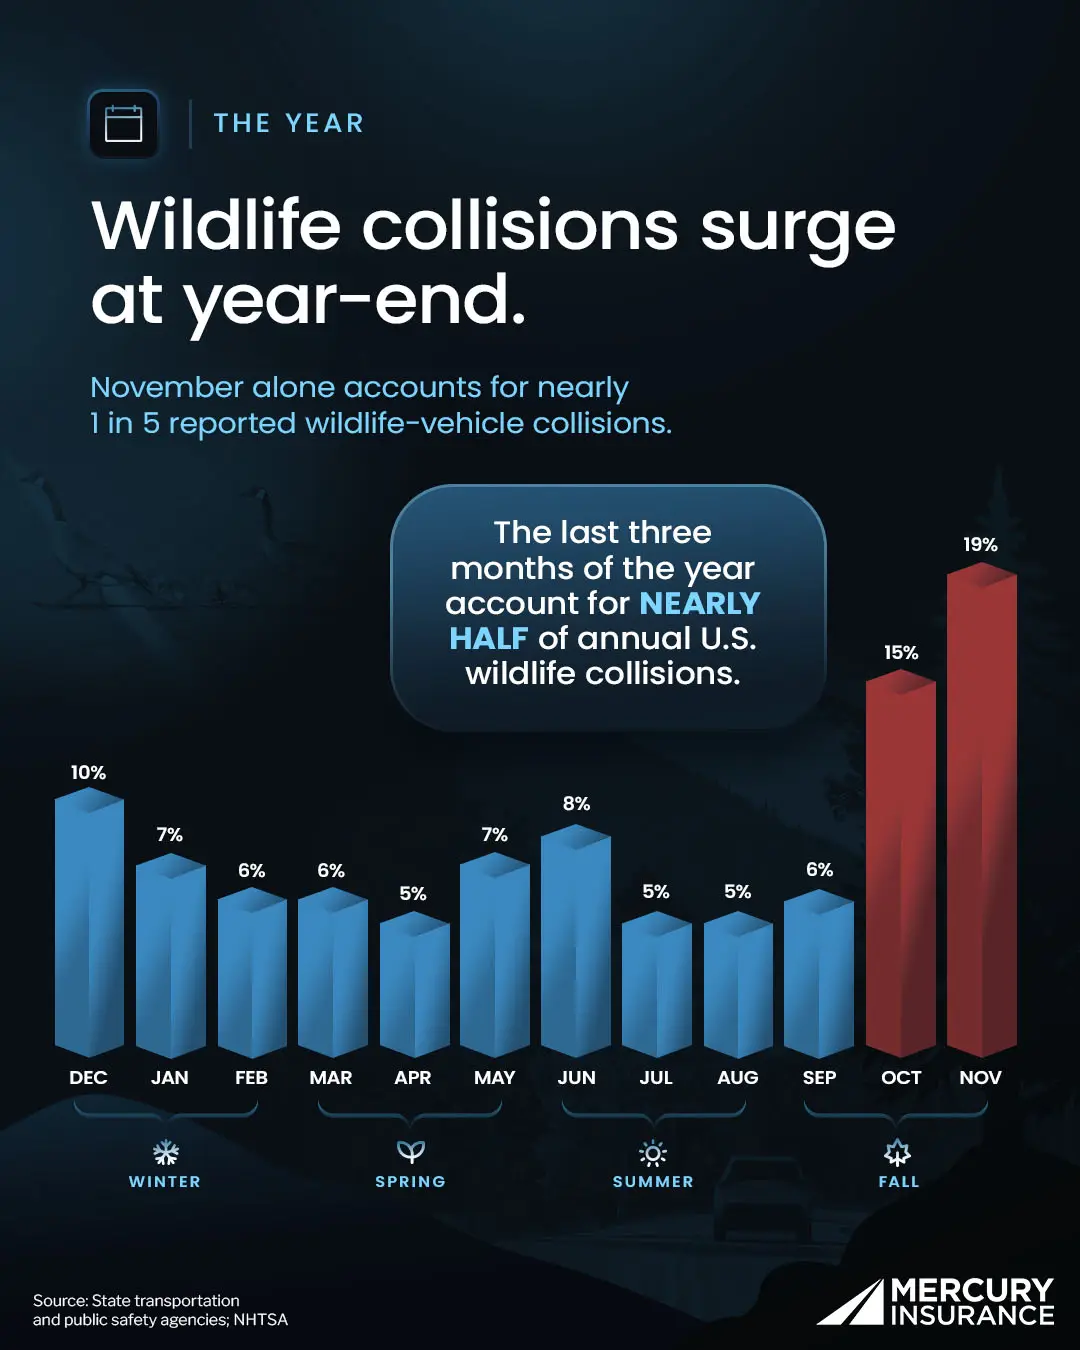
Wildlife collisions surge at year-end
From January through September, no single month accounts for more than 8% of annual reported collisions. The monthly share then more than doubles, rising from 6% in September to 15% in October before reaching its annual peak of 19% in November. That means nearly one in five of the year’s reported wildlife collisions occurs in November alone.
Together, October, November and December account for 44% of reported collisions, meaning nearly half of the year’s reports occur during just one-quarter of the calendar.
When the months are grouped by season, fall has the highest concentration of reported wildlife collisions:
- Fall (September through November): 40%
- Winter (December through February): 23%
- Spring (March through May): 18%
- Summer (June through August): 18%
Fall accounts for more than twice the share of reported collisions recorded during either spring or summer.
For drivers, the data points to a clear period for increased awareness. Beginning in October and continuing through December, motorists should be especially attentive on wooded and rural roads, scan both shoulders, and reduce speed in wildlife-crossing areas. That seasonal awareness becomes even more important during the morning and evening hours when collision reports are most concentrated.
The analysis did not test what causes the fall increase. Wildlife experts note that many commonly struck animals are active around dawn and dusk, and state transportation agencies also connect the fall deer-collision peak with breeding-season movement. In other words, the timing is consistent with known animal behavior, but the analysis should not be read as proof of one cause. See the University of Illinois Extension’s explanation of seasonal wildlife-collision patterns.
What Time of Day Do Wildlife Collisions Happen Most?
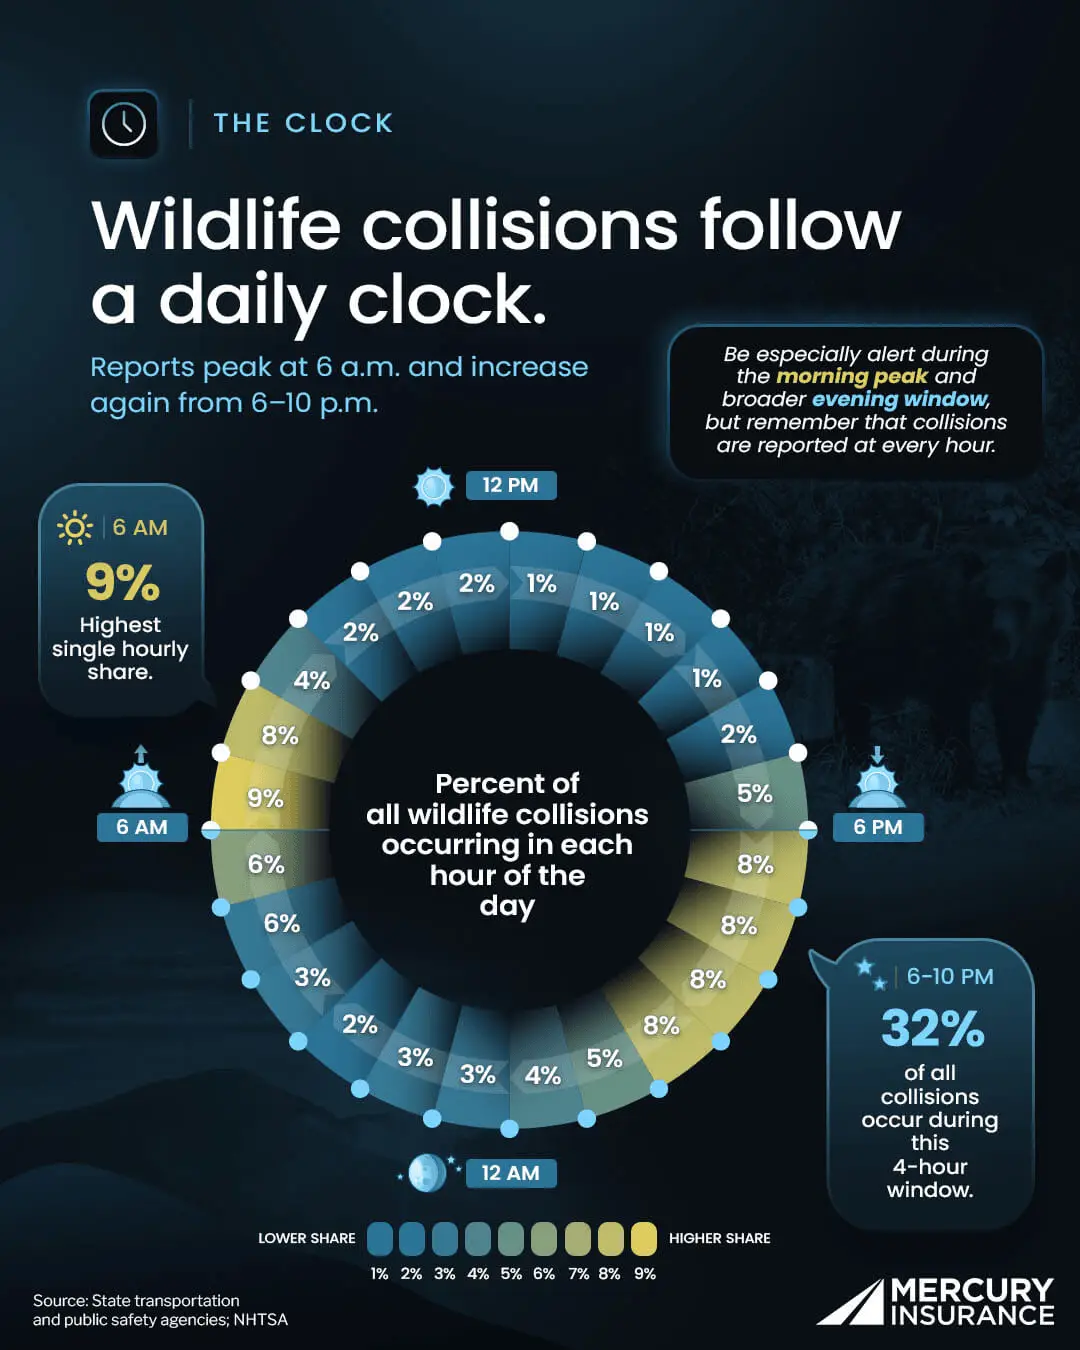
Wildlife collisions cluster around dawn and dusk, matching the natural activity patterns of the animals most often involved. White-tailed deer, foxes, and coyotes are considered crepuscular, meaning they are most active at dawn and dusk, and the data shows reported collisions concentrating in those same windows.
Collisions Peak Sharply at 6 a.m.
Morning wildlife collisions concentrate tightly around 6 a.m., which accounts for 9% of reported incidents, the largest share of any single hour. Unlike the broader evening concentration, the morning peak is sharp and short-lived.
Collision Reports Stay Elevated From 6 p.m. to 10 p.m.
Evening collision reports follow a broader pattern than the sharp morning peak. Reports remain elevated for roughly four hours, from 6 p.m. to 10 p.m., and this window accounts for 32% of all wildlife collisions in the data. These two periods give drivers specific times when reports are most concentrated.
Do Wildlife Collisions Vary by Day of the Week?
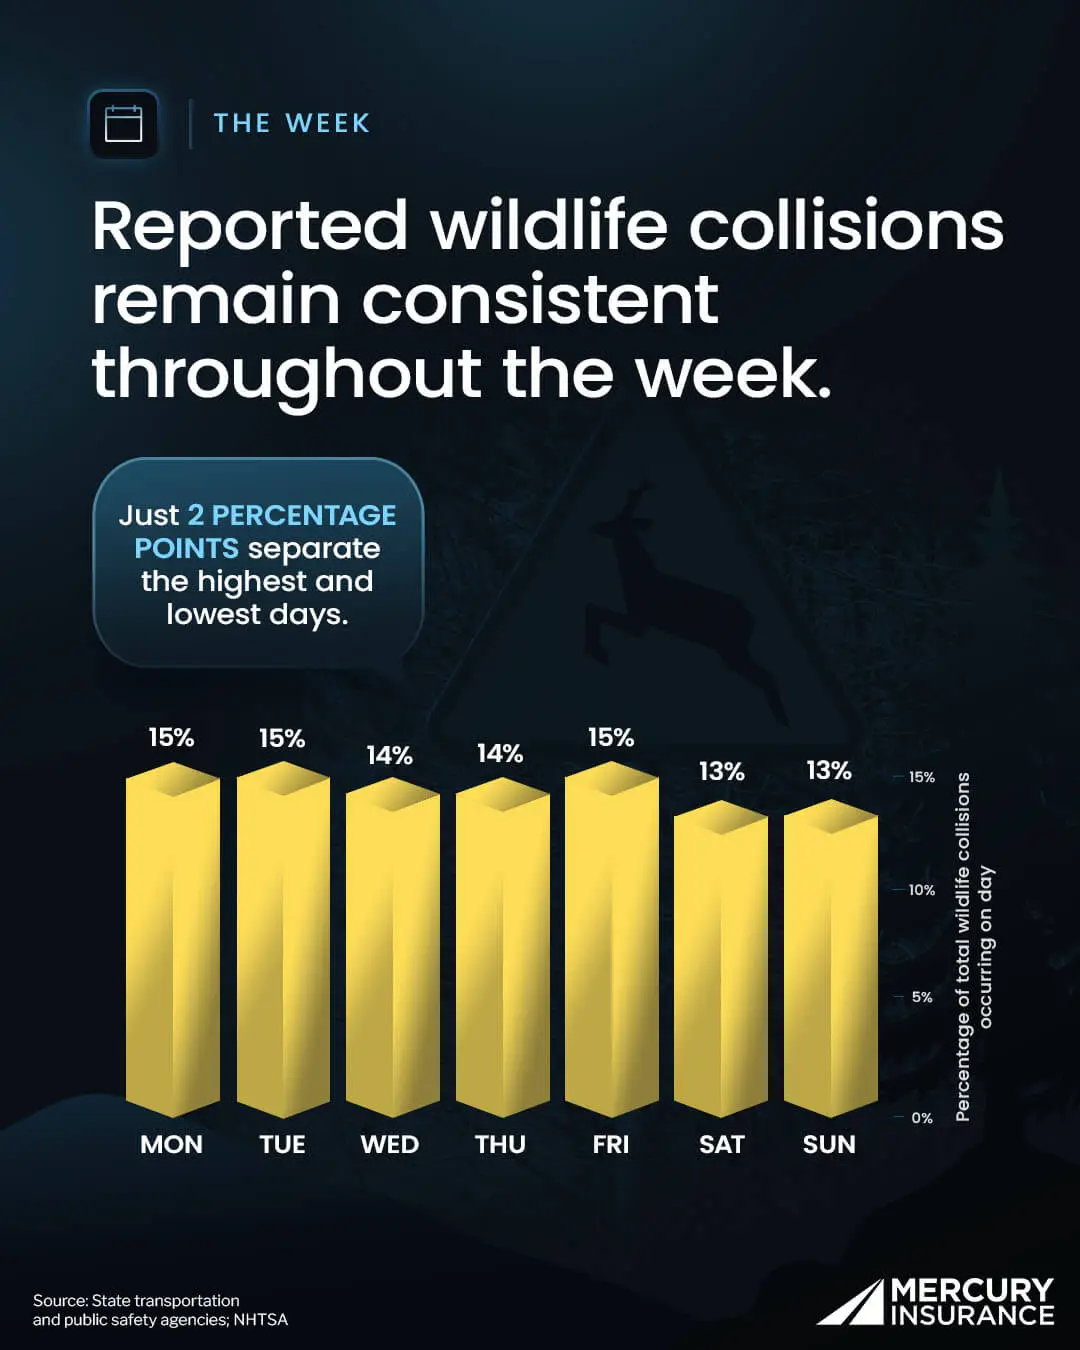
The weekly pattern is remarkably consistent. Every day accounts for between 13% and 15% of reported collisions, leaving just a two-percentage-point difference between the highest- and lowest-share days.
Monday, Tuesday, and Friday each account for 15% of reported collisions, while Saturday and Sunday each account for 13%. Wildlife collisions are reported consistently every day, so the data does not support treating any one day as meaningfully lower-collision than the others.
The narrow range suggests that wildlife collisions are not primarily a weekday or weekend phenomenon. Drivers should remain alert throughout the week rather than treating certain days as substantially safer.
When Are Wildlife Collisions Most Common in Each State?
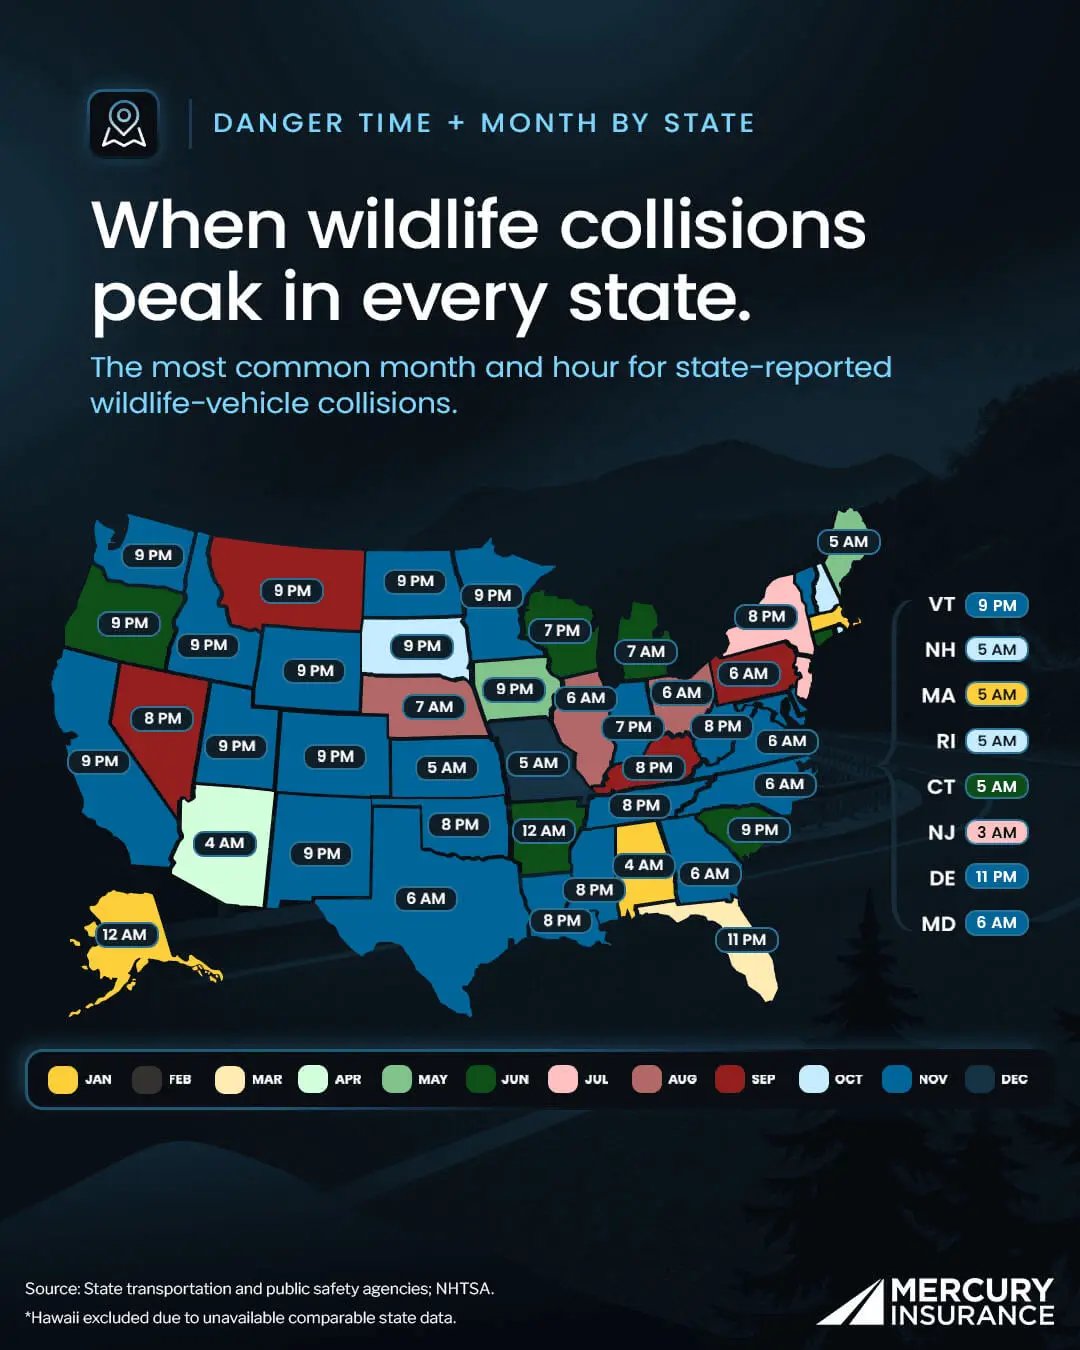
The national pattern does not describe every state equally. The map uses color to show the month with the largest share of reported collisions in each state and a time label to show that state’s peak hour. Many states cluster in October and November, but the calendar and clock shift in several parts of the country.
Drivers can use the national 6 a.m. and 6 p.m. to 10 p.m. windows as a broad guide, then check their state’s result for a more local view. As with the national clock, the map shows when reported crashes are concentrated; it does not adjust for the amount of driving in each hour.
What States Have the Most Reported Wildlife Collisions?
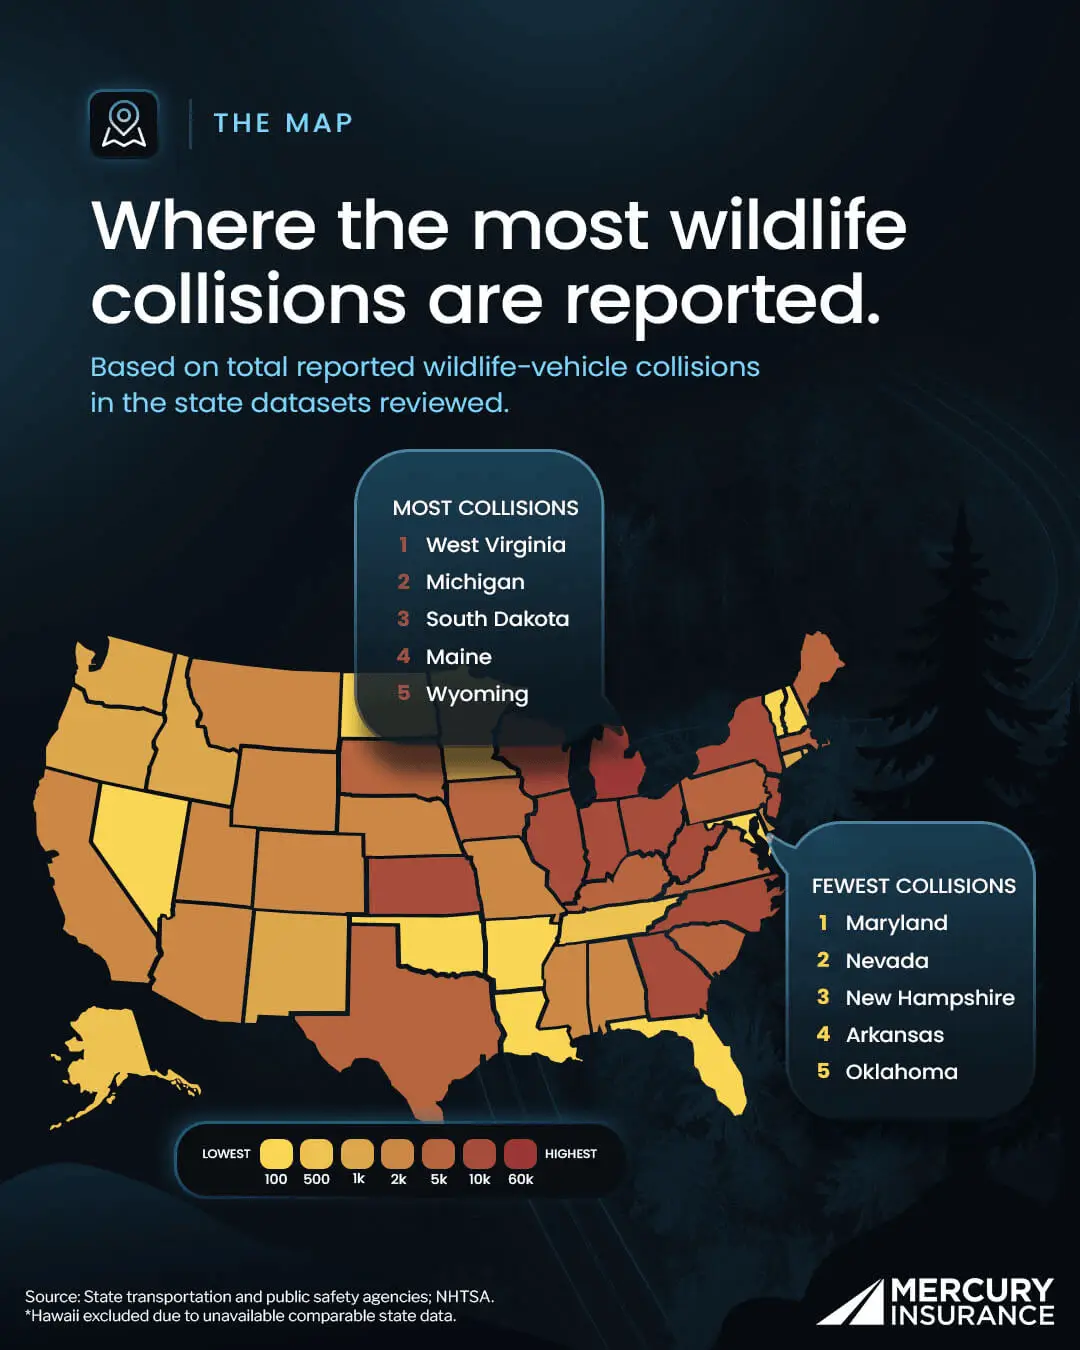
Among the datasets Mercury reviewed, West Virginia, Michigan and South Dakota report the largest wildlife-collision totals, followed by Maine and Wyoming. Maryland, Nevada, New Hampshire, Arkansas and Oklahoma report the smallest totals in the compiled data.
That is a ranking of reported counts, not a standardized ranking of collision likelihood. Some states report all wildlife collisions, some publish deer-only crashes, and some have different thresholds for when a crash enters the official record. Population, road mileage, and driving exposure also differ. These results are most useful for seeing what each state reports; they should not be used to conclude that a driver in one state is definitively more or less likely to hit an animal than a driver in another.
Where Are Fatal Wildlife Collisions Rising Fastest?
A separate analysis of the National Highway Traffic Safety Administration’s Fatality Analysis Reporting System examines longer-term change in fatal crashes involving live animals.
From 2014 through 2024, Michigan, Tennessee and Virginia show the largest average annual increases in the fatal-collision rate. Delaware, New Hampshire and Maine show the largest decreases. Most notably, four of the five states with the largest decreases are in New England.
Fatal wildlife crashes are comparatively rare, so a small change in the underlying number can produce a large percentage swing, especially in less populous states. These figures describe the direction of the historical rate; they are not forecasts of future fatalities.
What the Wildlife Collision Clock Means for Drivers
Mercury’s analysis shows when reported wildlife collisions are most concentrated; it does not claim these incidents can always be predicted or avoided. The three clearest patterns are the year-end surge from October through December, the sharp 6 a.m. peak, and the broader concentration from 6 p.m. to 10 p.m.
Constantly scanning the road and shoulders during these periods, especially on rural and wooded routes, is one of the most direct ways drivers can respond to what the data shows.
Mercury analyzed data as part of its extensive research efforts to educate drivers on the risks of the road and to ensure all drivers remain protected with auto insurance options, such as comprehensive coverage in the event of a wildlife collision.
What to Do After Hitting a Deer or Other Animal
Once the vehicle has stopped, focus on people and traffic first:
- Move to a safe location if the vehicle can be driven, turn on the hazard lights, and stay clear of moving traffic.
- Call 911 if anyone is hurt, the vehicle is disabled, the animal is blocking traffic, or the scene remains dangerous. Reporting requirements vary by state and by the severity of the crash.
- Do not approach an injured animal. Frightened wildlife can move suddenly and may be dangerous.
- Photograph the vehicle, the roadway, and the surrounding scene from a safe position, and note the time and location.
- Contact the insurer promptly and keep receipts for towing or emergency repairs. Comprehensive coverage typically applies to vehicle damage from hitting an animal, subject to the policy terms and deductible.
Methodology
Collision frequency and timing
Mercury compiled wildlife-vehicle collision records from official state transportation and public safety reports, dashboards, and datasets. The analysis used 2024 data when a comparable statewide dataset was available. When it was not, the analysis used the most recent state data available or NHTSA FARS fatal-crash data, as identified in the state source appendix. The national frequency estimate was calculated from the combined reported total. Monthly, day-of-week, and hourly figures are presented as shares of the reported collisions included in the analysis.
State totals
The state map ranks raw reported totals. States do not use one national reporting definition: some publish all animal-related crashes, some publish deer-only crashes, and reporting thresholds vary. The map is therefore descriptive and should not be treated as an exposure-adjusted comparison of each driver’s collision likelihood. Hawaii was not included in the analysis due to unavailable comparable state data.
Fatal collision trends
For the long-term trend analysis, Mercury used NHTSA’s FARS data for fatal motor vehicle crashes involving collisions with live animals from 2014 through 2024. State population figures from the 2020 U.S. Census were used to calculate fatal crashes per 100,000 residents.
Limitations
The analysis measures reported crashes; unreported incidents are not captured. Reporting definitions, thresholds, source years, and animal categories vary by state. Time-of-day and day-of-week shares are not adjusted for traffic volume, vehicle miles traveled, or daylight conditions. Percentages are rounded, so displayed values may not total exactly 100%. The analysis identifies patterns and associations; it does not establish why the patterns occur.
When Do Wildlife Collisions Peak in Each State?
National trends only tell part of the story. The month, day, and hour with the most reported wildlife-vehicle collisions vary considerably across the country. The table below identifies the peak collision period in each state based on the data reviewed.
“Peak” refers to the period with the most reported collisions within each state’s dataset. These findings are not adjusted for traffic volume, miles driven, or differences in state reporting practices, so they should not be interpreted as a direct measure of individual driver risk.
|
State |
Month With Most Reported Collisions |
Day With Most Reported Collisions |
Hour With Most Reported Collisions |
|
Alabama |
January |
Tuesday |
4:00am-4:59am |
|
Alaska |
January |
Sunday |
12:00am-12:59am |
|
Arizona |
April |
Thursday |
4:00am-4:59am |
|
Arkansas |
June |
Friday |
12:00am-12:59am |
|
California |
November |
Saturday |
9:00pm-9:59pm |
|
Colorado |
November |
Saturday |
9:00pm-9:59pm |
|
Connecticut |
June |
Tuesday |
5:00am-5:59am |
|
Delaware |
November |
Tuesday |
11:00pm-11:59pm |
|
Florida |
March |
Monday |
11:00pm-11:59pm |
|
Georgia |
November |
Friday |
6:00-6:59am |
|
Hawaii |
Not included in the analysis due to unavailable comparable state data |
||
|
Idaho |
November |
Sunday |
9:00pm-9:59pm |
|
Illinois |
August |
Friday |
6:00-6:59am |
|
Indiana |
November |
Sunday |
7:00pm-7:59pm |
|
Iowa |
May |
Friday |
9:00pm-9:59pm |
|
Kansas |
November |
Wednesday |
5:00pm-5:59pm |
|
Kentucky |
September |
Sunday |
8:00pm-8:59pm |
|
Louisiana |
November |
Friday |
8:00pm-8:59pm |
|
Maine |
May |
Friday |
5:00pm-5:59pm |
|
Maryland |
November |
Sunday |
6:00-6:59am |
|
Massachusetts |
January |
Tuesday |
5:00am-5:59am |
|
Michigan |
June |
Tuesday |
7:00am-7:59am |
|
Minnesota |
November |
Friday |
9:00pm-9:59pm |
|
Mississippi |
November |
Sunday |
8:00pm-8:59pm |
|
Missouri |
December |
Monday |
5:00pm-5:59pm |
|
Montana |
September |
Monday |
9:00pm-9:59pm |
|
Nebraska |
August |
Sunday |
7:00am-7:59am |
|
Nevada |
September |
Monday |
8:00pm-8:59pm |
|
New Hampshire |
October |
Tuesday |
5:00pm-5:59pm |
|
New Jersey |
July |
Tuesday |
3:00am-3:59am |
|
New Mexico |
November |
Monday |
9:00pm-9:59pm |
|
New York |
July |
Friday |
8:00pm-8:59pm |
|
North Carolina |
November |
Sunday |
6:00-6:59am |
|
North Dakota |
November |
Saturday |
9:00pm-9:59pm |
|
Ohio |
August |
Monday |
6:00-6:59am |
|
Oklahoma |
November |
Friday |
8:00pm-8:59pm |
|
Oregon |
June |
Tuesday |
9:00pm-9:59pm |
|
Pennsylvania |
September |
Sunday |
6:00-6:59am |
|
Rhode Island |
October |
Wednesday |
5:00am-5:59am |
|
South Carolina |
June |
Tuesday |
9:00pm-9:59pm |
|
South Dakota |
October |
Sunday |
9:00pm-9:59pm |
|
Tennessee |
November |
Saturday |
8:00pm-8:59pm |
|
Texas |
November |
Friday |
6:00-6:59am |
|
Utah |
November |
Friday |
9:00pm-9:59pm |
|
Vermont |
November |
Sunday |
9:00pm-9:59pm |
|
Virginia |
November |
Sunday |
6:00-6:59am |
|
Washington |
November |
Friday |
9:00pm-9:59pm |
|
West Virginia |
November |
Sunday |
8:00pm-8:59pm |
|
Wisconsin |
June |
Saturday |
7:00pm-7:59pm |
|
Wyoming |
November |
Saturday |
9:00pm-9:59pm |
How to Avoid Hitting a Deer: 6 Ways to Reduce the Chance of a Collision
You can’t always avoid an animal that darts into the road at highway speed, but a few habits can lower the odds of a collision or reduce its severity:
Step 1: Slow down in posted wildlife-crossing zones
These areas are marked with signage for a reason, and reduced speed gives you more reaction time.
Step 2: Scan the road
Scan the road and both shoulders, not just what’s directly ahead. This habit helps with wildlife and with other roadside hazards.
Step 3: Add extra caution during peak windows
The data shows a sharp spike around 6 a.m. and an extended elevated period from 6 p.m. to 10 p.m.
Step 4: Use your headlights strategically
On dark, rural roads with no oncoming traffic, high beams extend how far ahead you can spot an animal. Dim them as soon as another vehicle approaches.
Step 5: Assume there's more than one animal nearby
Many species, including deer, travel in groups, so one animal near the roadside often means others are following close behind.
Step 6: Brake firmly
If a collision becomes unavoidable, brake firmly and keep your vehicle straight. Swerving to avoid an animal increases the risk of losing control or crossing into oncoming traffic.
FAQ
How often do wildlife collisions happen in the U.S.?
More than 340,000 wildlife-vehicle collisions are reported annually in the state data Mercury reviewed. That works out to approximately one reported collision every 90 seconds. Because minor crashes may go unreported and state definitions vary, the figure is an estimate from available official records rather than a complete count of every incident.
What month do most deer and wildlife collisions happen?
November has the largest monthly share in the analysis at 19%. October accounts for 15% and December accounts for 10%, meaning the final three months of the year represent 44% of annual reported wildlife collisions.
What time of day do most wildlife collisions happen?
The 6 a.m. hour has the highest single-hour share at 9%. Reported collisions also remain elevated from 6 p.m. through 10 p.m.; together, those four evening hours account for 32% of the total.
What time are deer most active?
Deer are crepuscular, meaning they are generally most active around dawn and dusk. That behavior overlaps with the morning and evening collision concentrations in Mercury’s data, although collision timing also reflects when and where people are driving.
Which states report the most wildlife collisions?
West Virginia, Michigan, and South Dakota report the largest totals in the compiled data, followed by Maine and Wyoming. Because state definitions and reporting thresholds differ, these are raw reported counts, not a standardized ranking of an individual driver’s odds of hitting an animal.
Do wildlife collisions surge at year-end?
Yes. October through December account for 44% of annual reported wildlife collisions. When grouped by season, fall accounts for 40% of reports, followed by winter at 23%. The study did not test the cause, but the pattern overlaps with fall deer movement and breeding season in many states.
What should I do if a deer runs in front of my car?
Brake steadily and keep the vehicle as straight as possible. Swerving can increase the chance of entering oncoming traffic, leaving the road, or hitting another object. If a crash occurs, move to safety if possible and call 911 when there are injuries, a disabled vehicle, or an immediate roadway hazard.
Does car insurance cover hitting a deer or other animal?
Comprehensive auto coverage typically covers vehicle damage from hitting a deer or another animal, subject to the policy terms and deductible. Liability-only coverage does not pay for damage to the policyholder’s own vehicle, so drivers should confirm which coverages they carry.
How can I reduce the likelihood of hitting a deer while driving?
Slow down in posted wildlife-crossing zones, scan both shoulders, expect additional deer after one crosses, and use high beams on dark roads when no other traffic is approaching. Extra attention in fall and during the morning and evening peaks addresses the periods when reported collisions are most concentrated.

The Mercury Marketing Team is made up of professionals in the fields of Content Creation, Public Relations, Social Media and Journalism. The team works together to deliver professionally written and researched content to provide information for consumers.