
As the U.S. continues to face more frequent and intense natural disasters, from hurricanes and wildfires to floods and severe storms, these events are doing more than just causing damage. But are they changing where people live, how they move, and what homes are worth?
To better understand the connection between climate risk, population movement, and real estate trends, we conducted an in-depth analysis using data from the NOAA Storm Events Database, the U.S. Census Bureau, and Zillow.
By comparing average annual rates of change between 2010–2014 and 2020–2024, we identified where those trends are accelerating most sharply. This method offered a more stable and revealing view than single-year snapshots, allowing us to better understand how increasing climate risks align with shifts in population and fluctuations in the housing market.
Key Findings
- El Paso, Texas; Oxnard, California; and Baton Rouge, Louisiana, are the U.S. cities experiencing the fastest growth in weather-related hazards.
- Salt Lake City, Utah; San Jose, California; and Albuquerque, New Mexico, have experienced the slowest growth in weather-related hazards.
- Cities considered “high-risk” for weather hazards are experiencing faster population growth on average than those considered low- or medium-risk.
- Home values in high-risk areas increase an average of 8% a year, compared to increasing just 7% a year in low-risk areas.
- Although one-fifth of the 25 high-risk cities are in California, population growth is slowing across the state, regardless of risk level.
Weather hazards are on the rise around the country
Baton Rouge, Louisiana; El Paso, Texas; and Oxnard, California have experienced the fastest increase in weather-related hazards over the past decade. Each of these cities faces distinct risks—from floods and hurricanes to extreme heat and wildfires—but all have seen sharp rises in their exposure to natural disasters.
Baton Rouge’s flood-prone location along the Mississippi River, combined with intense rainfall events like the 2016 storm that brought over 20 inches of rain, underscores its growing vulnerability. El Paso, situated in the desert Southwest, is experiencing more frequent and severe heat waves and prolonged droughts. Oxnard, though coastal, borders fire-prone grassland and chaparral, making it susceptible to wildfires during drought conditions and Santa Ana wind events.
Salt Lake City, Utah, San Jose, California, and Albuquerque, New Mexico, have seen the slowest growth in weather-related hazards over the past decade. While no place is entirely immune to climate risks, these cities have experienced relatively modest increases in hazard frequency compared to others in the country.
But that’s not the whole picture. Once we identified high- and low-risk weather cities nationwide, we took a closer look at the highest- and lowest-risk counties in each state.
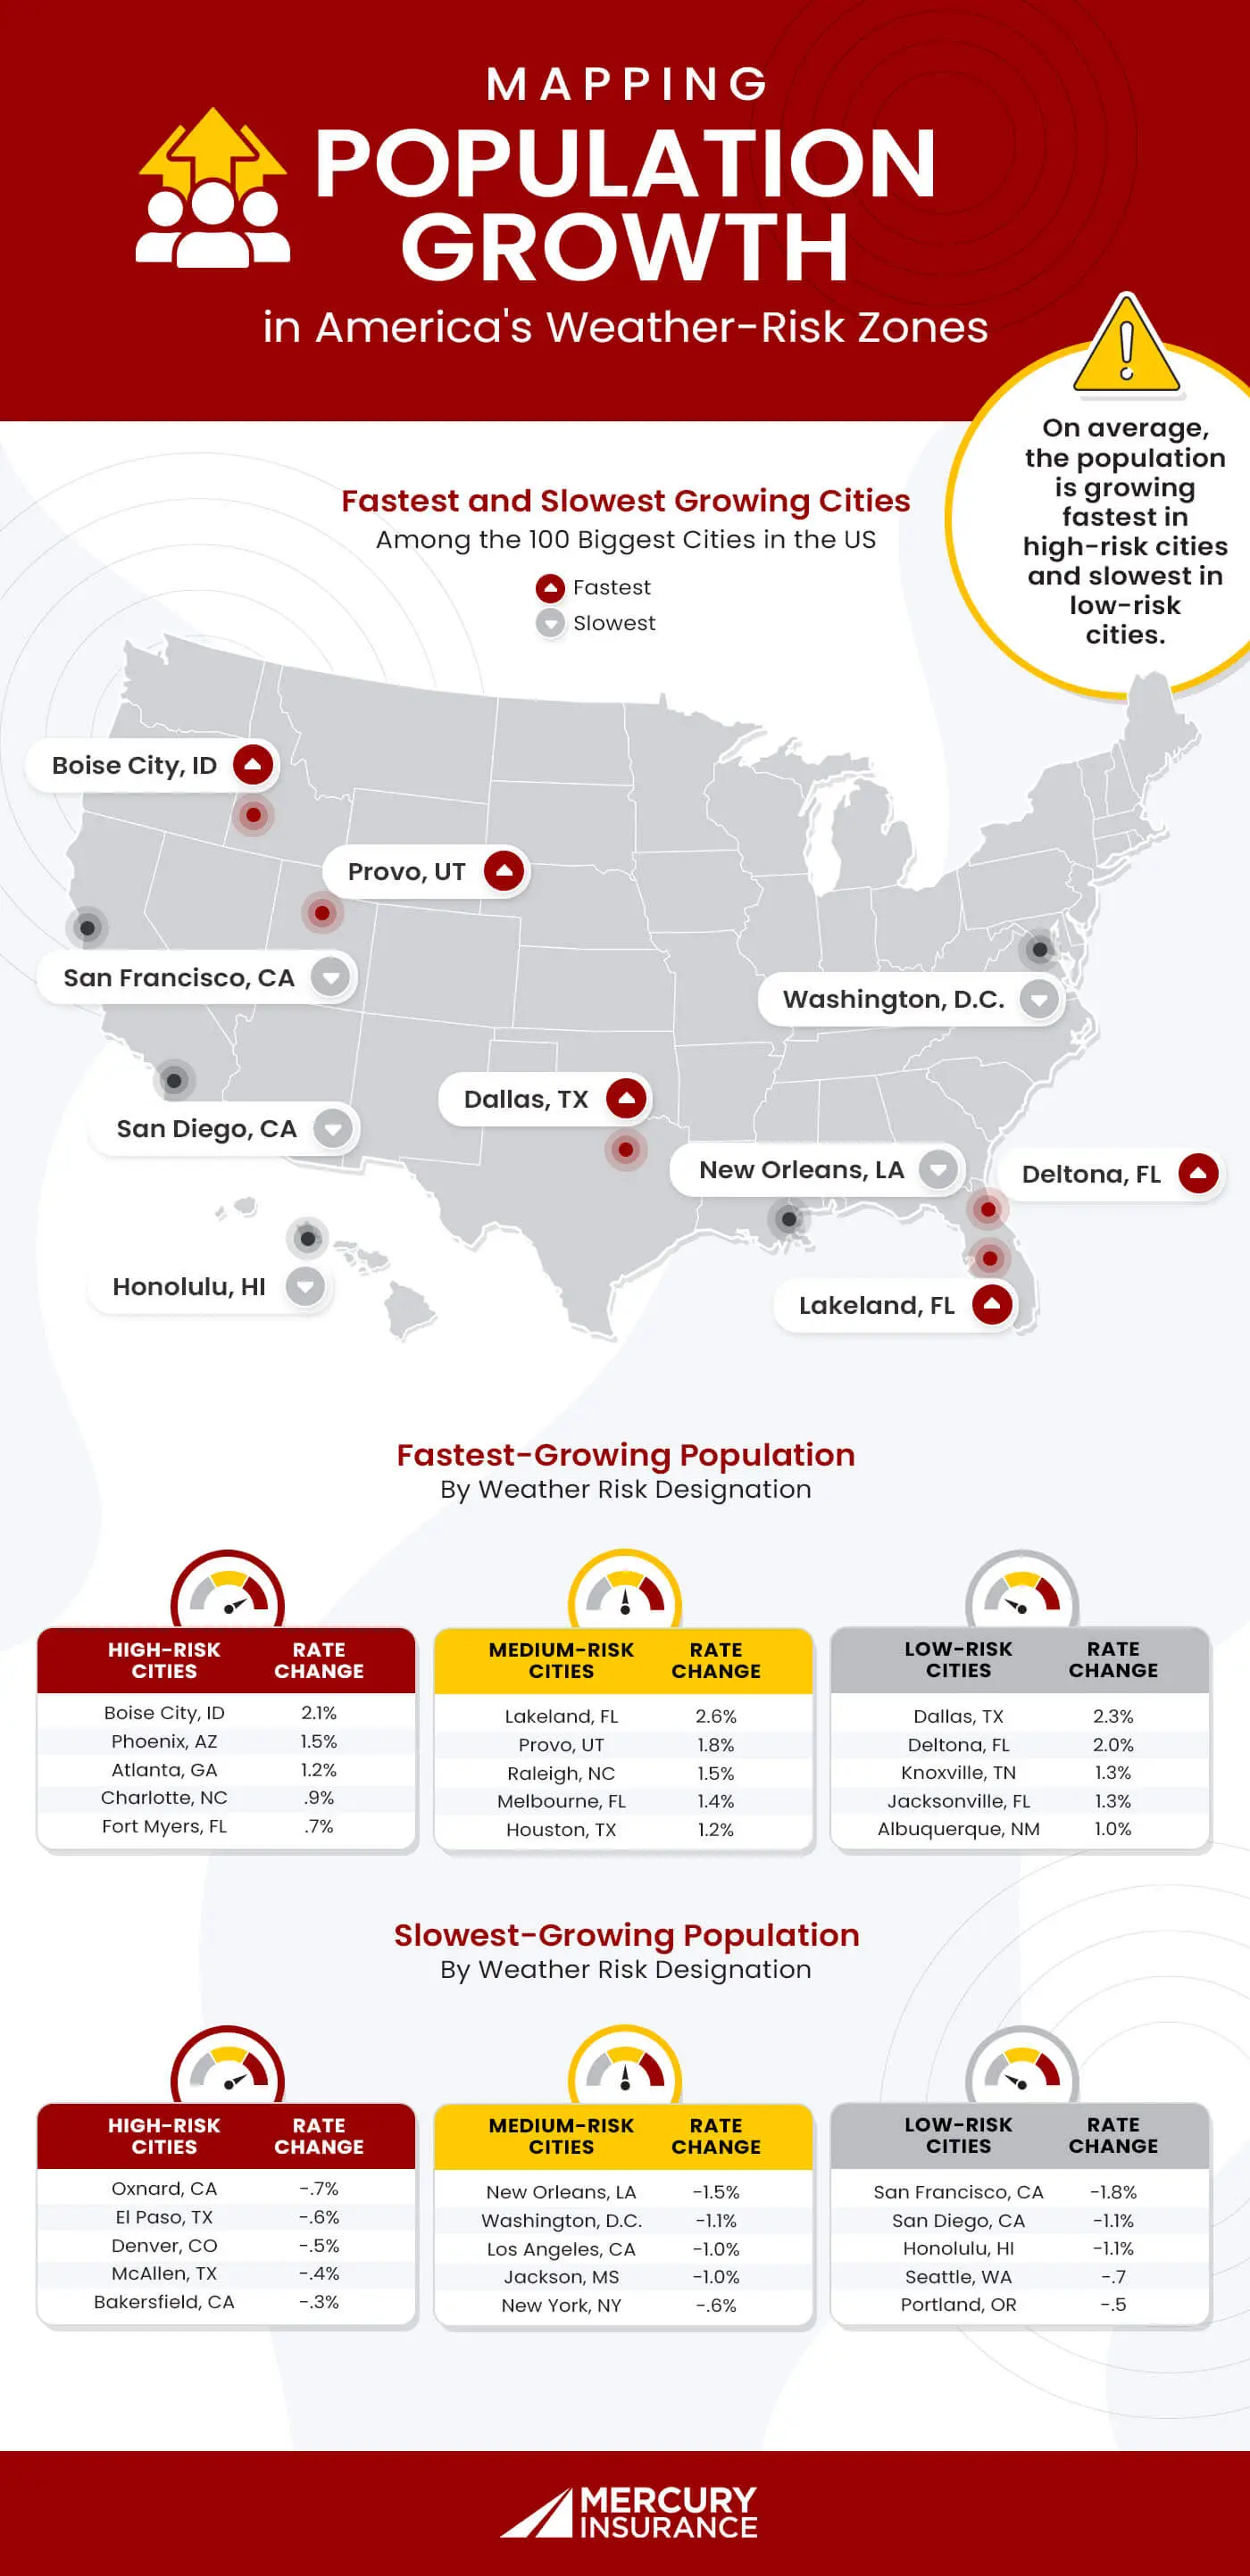
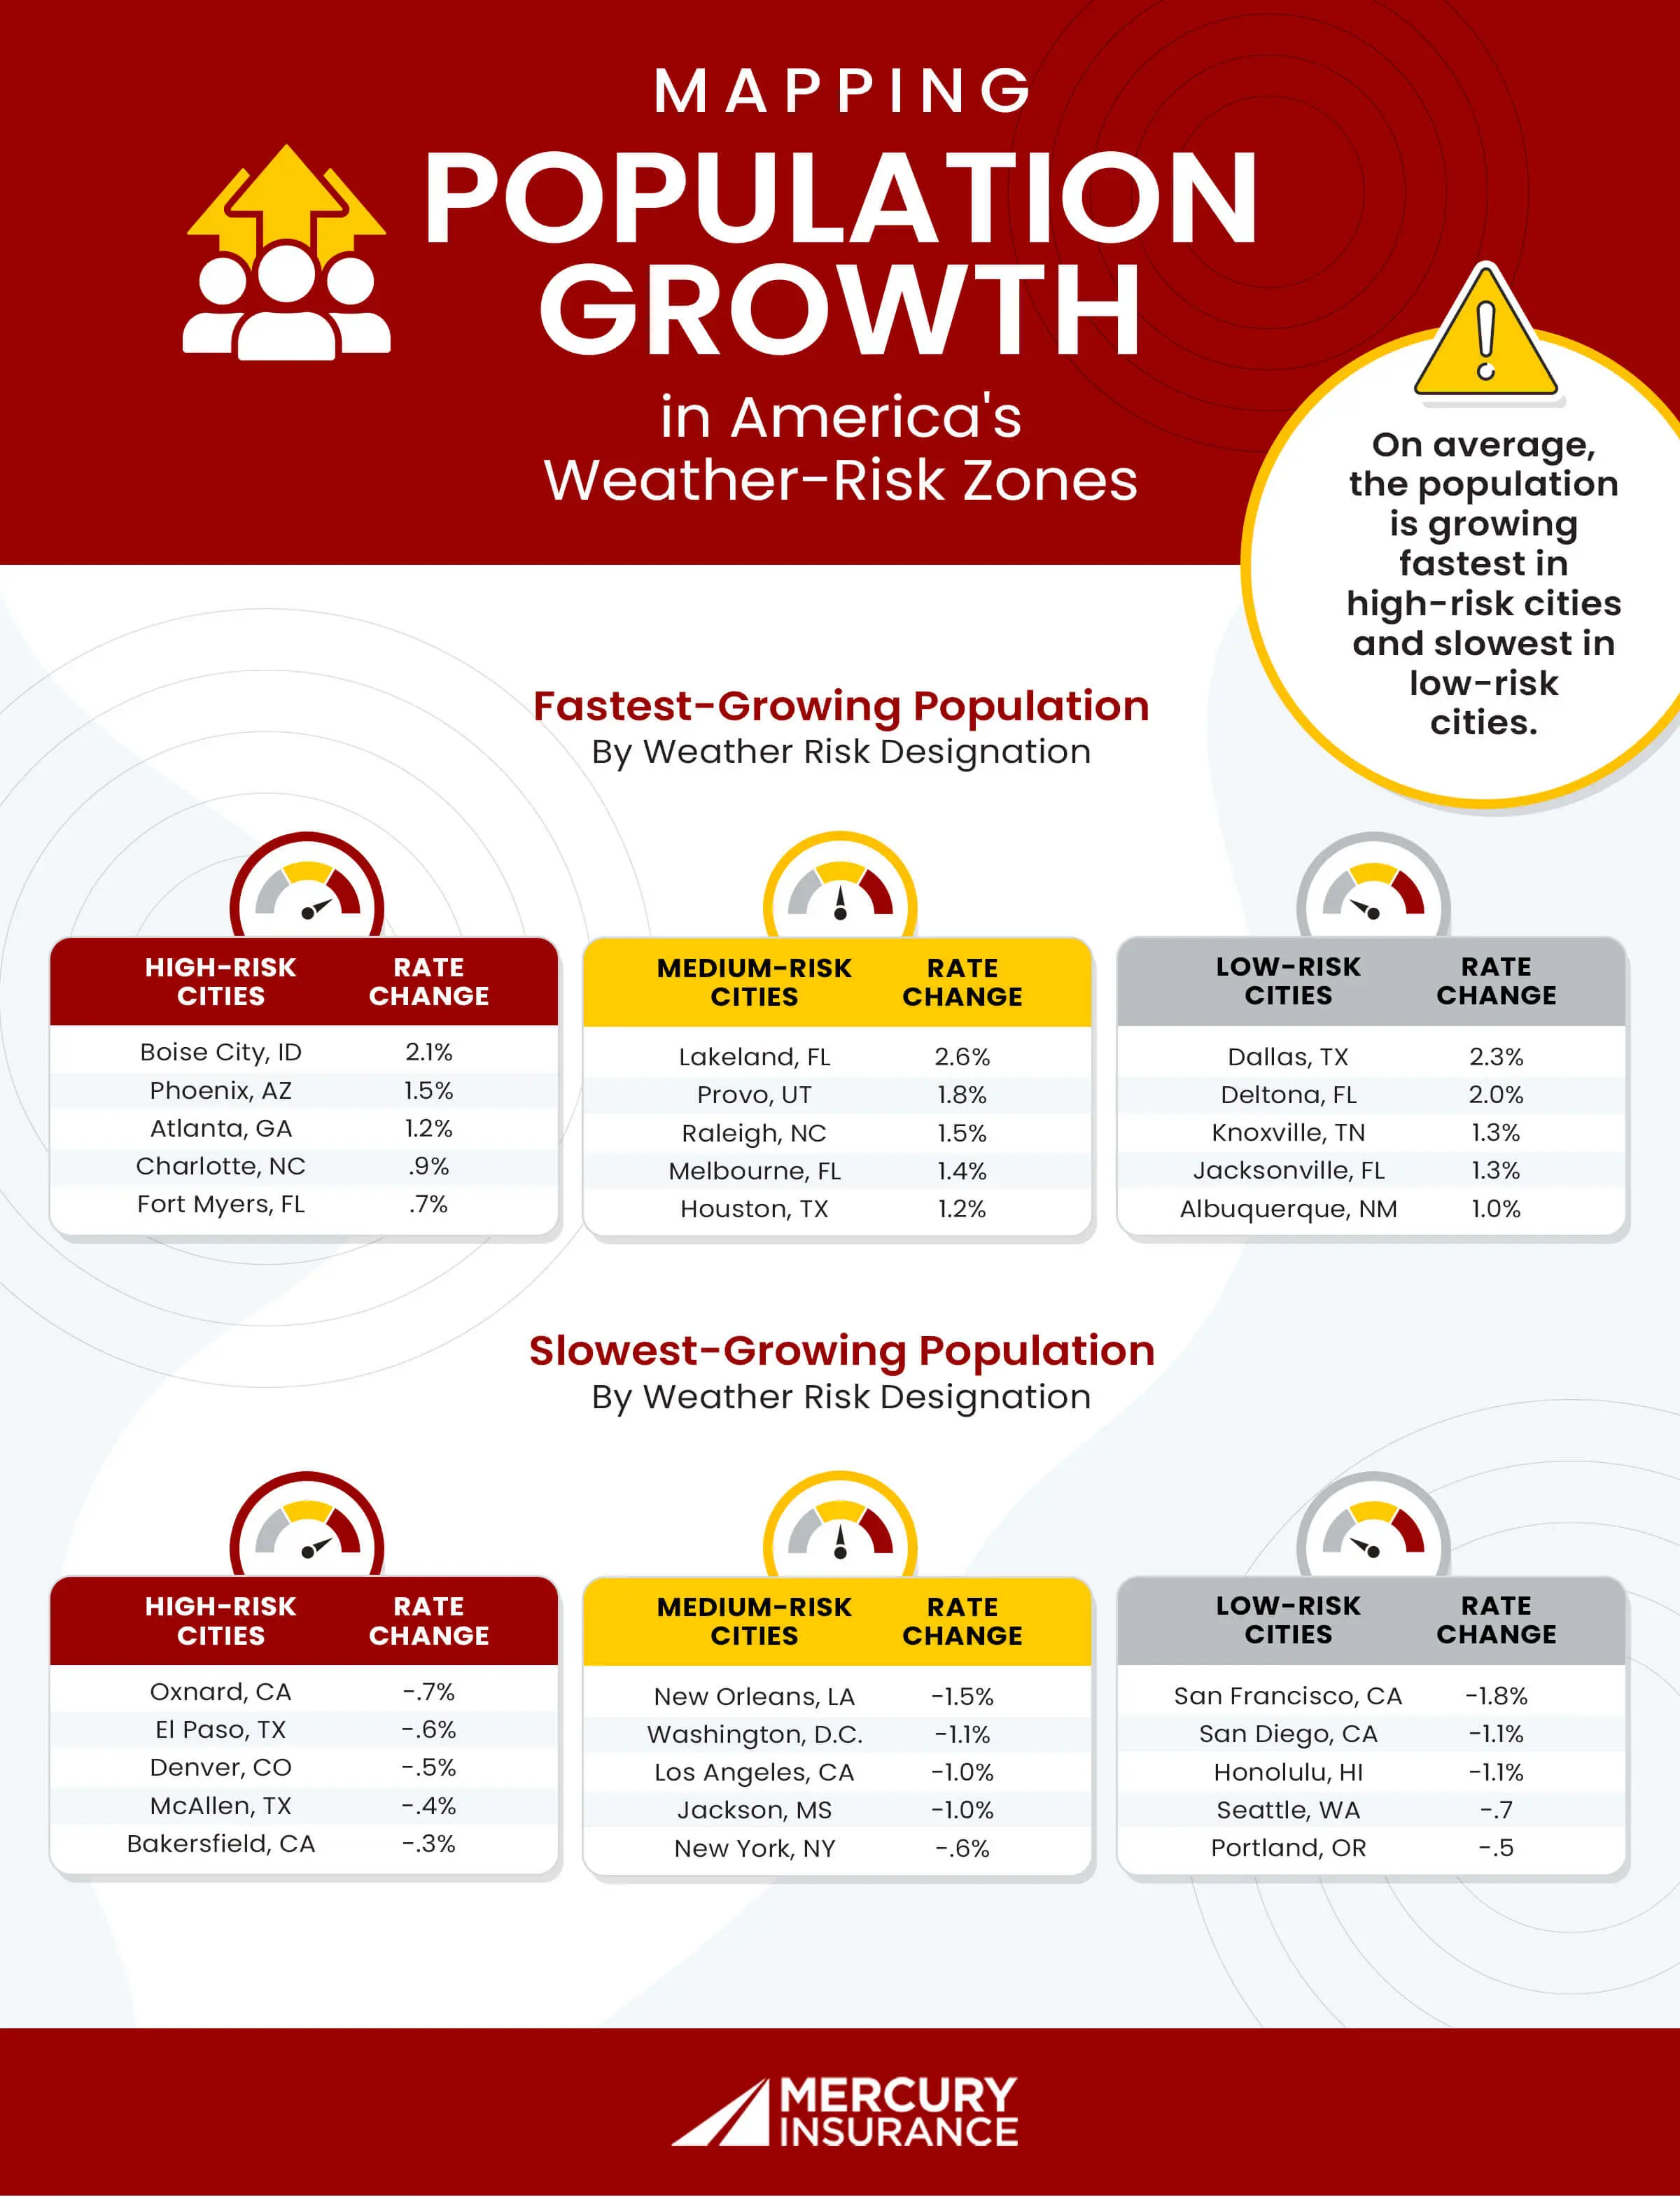
Cities seeing the fastest increases in storm hazards are also seeing some of the fastest population growth
To understand whether rising climate risks are influencing where people choose to live, we analyzed population trends across cities with varying levels of weather hazard risk. Using U.S. Census data, we compared the average annual population growth rates from 2010–2014 to 2020–2024.
Nationwide, the average annual growth rate rose from just 0.04% in the earlier period to 0.34% in the later one, a significant shift in how quickly populations are growing across the 100 largest U.S. cities.
Interestingly, high-risk areas—those experiencing the sharpest rise in weather-related hazards—are also growing at the fastest rate. Medium-risk areas followed closely, while low-risk cities exhibited the slowest average population growth.
Among the 20 fastest-growing cities, four are high-risk, and six are low-risk. Lakeland, Florida, classified as a medium-risk city, ranks as the fastest-growing city in the country.
On the other end of the spectrum, San Francisco, a low-risk city, is seeing the slowest population growth. Of the 20 slowest-growing cities, seven are high-risk and seven are low-risk, underscoring that while high-risk cities may be growing quickly in some cases, others are starting to see stagnation or decline.
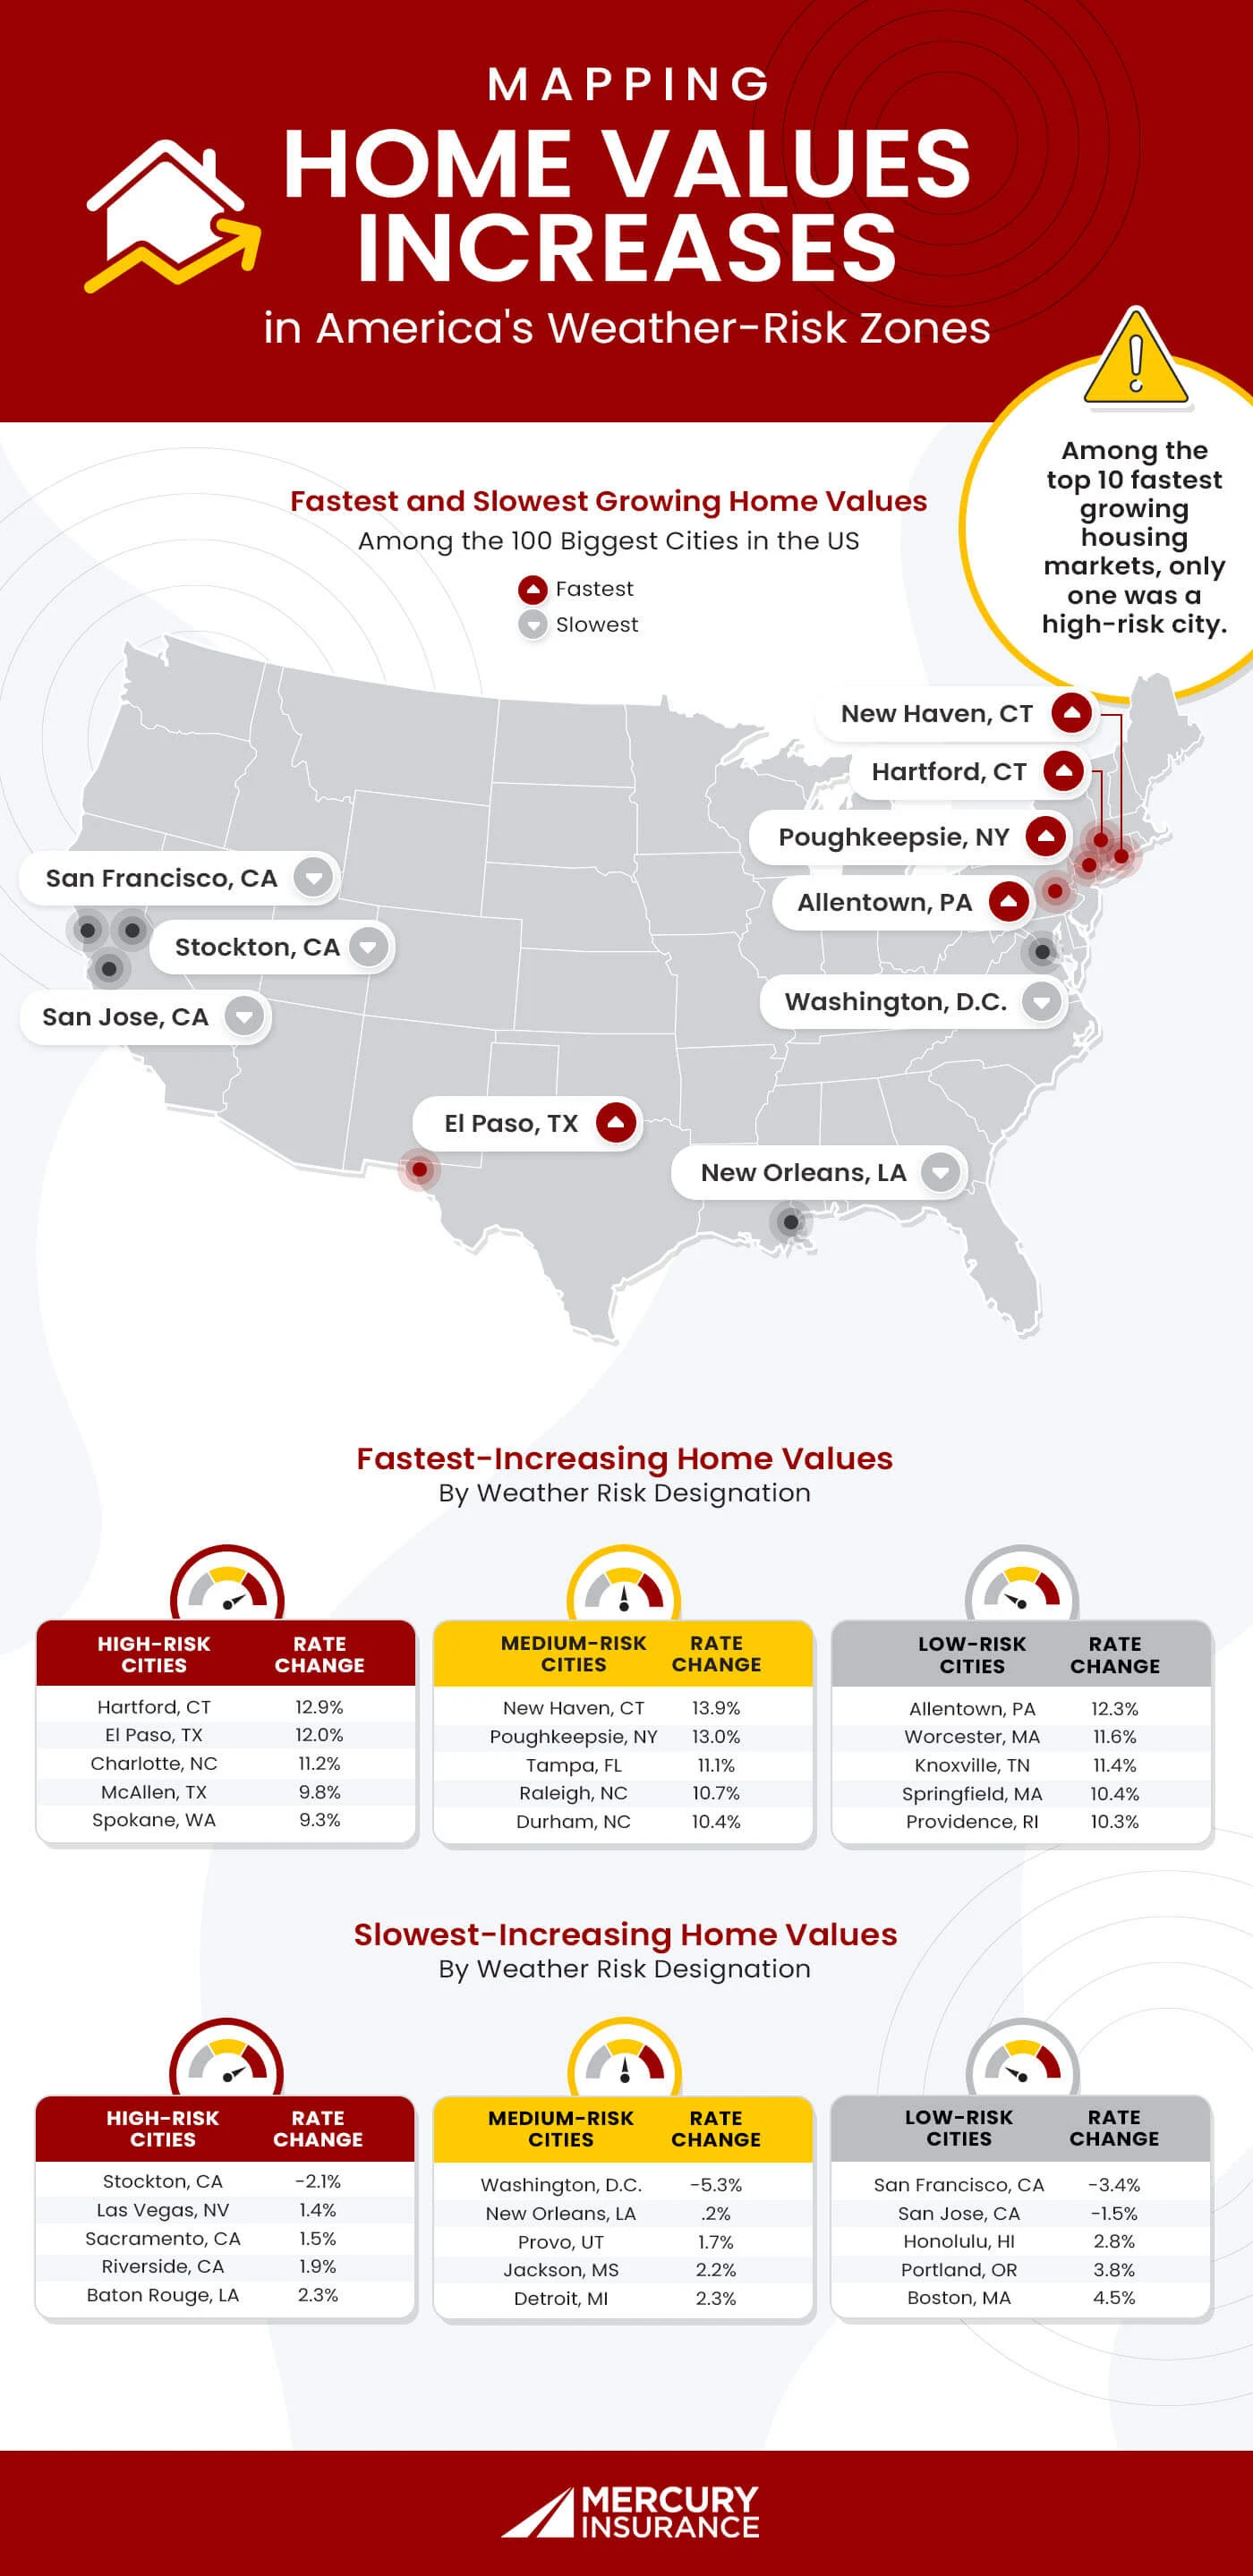
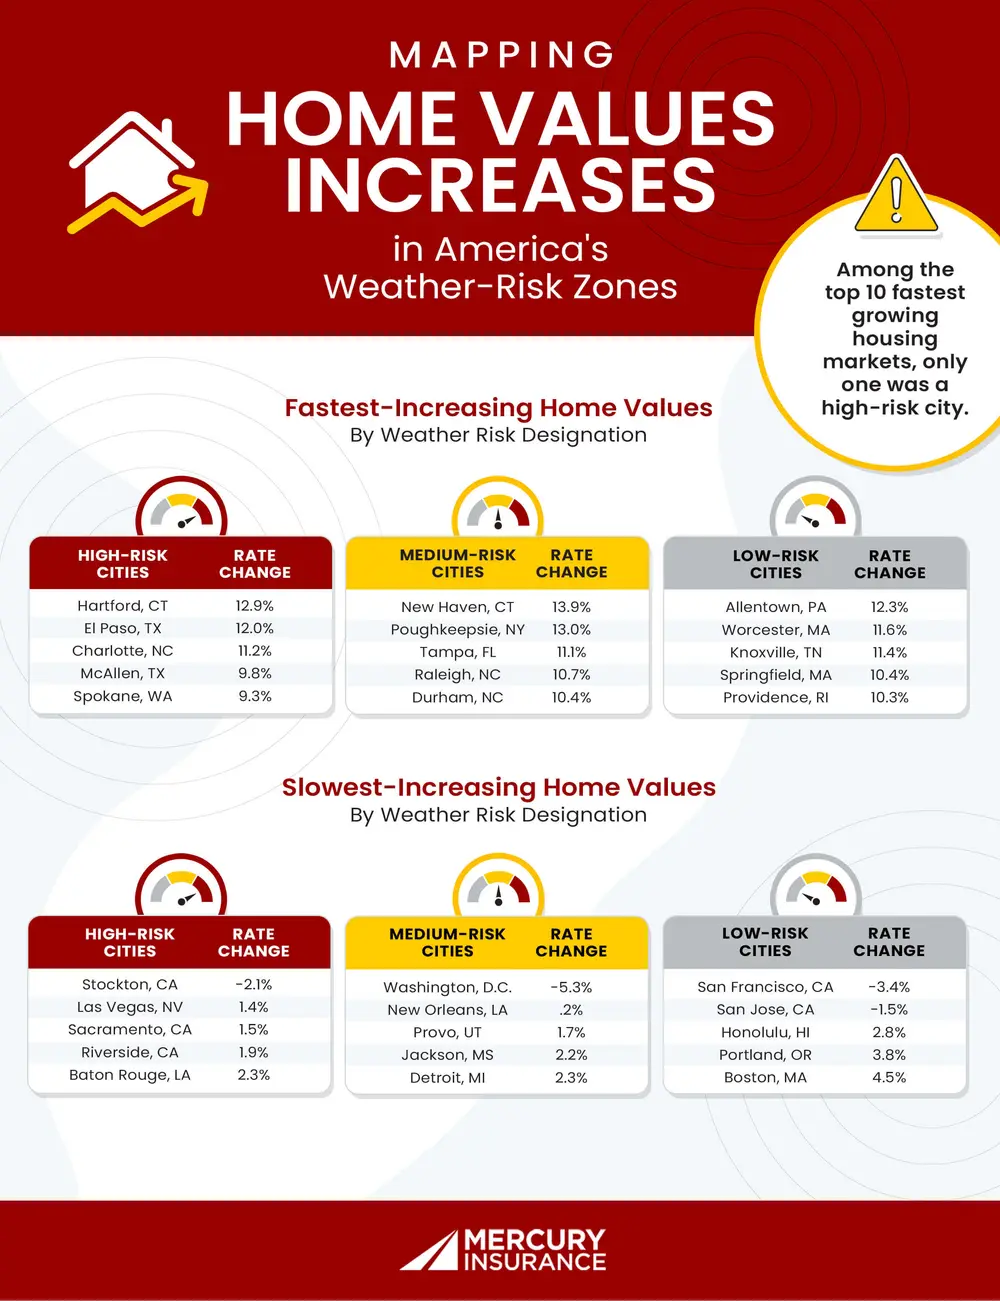
Home values remain unaffected by weather hazards, for now
Lastly, we sought to determine whether weather hazards have an impact on home values. Are people willing to pay a premium for homes in high-risk areas? To determine this, we calculated the average home price increase from 2010 to 2014 and compared it to the average home price increase from 2020 to 2024.
Nationwide, housing prices increased by an average of just 1% per year from 2010 to 2014. However, from 2020 to 2024, home prices increased by an average of 8% per year, representing a seven percentage point increase. Among the 20 cities with the fastest-growing home prices, five were located in high-risk areas and seven were in low-risk areas. Cities with the slowest-growing home values included eight high-risk cities and four low-risk regions. New Haven, Connecticut, a medium-risk area, has the fastest-growing home prices in the nation, while Washington, D.C., also a medium-risk city, has the slowest-growing home values.
The impact of weather hazards on your city
Not only are increasing weather hazards impacting the landscape, but they’re also changing where Americans live. Even as high-risk cities continue to see the fastest population growth, low-risk cities are still starting to see substantial growth. Additionally, home values are increasing the fastest in medium- and low-risk cities, revealing the price Americans are willing to pay for safety.
To help you better understand the impacts in your neighborhood, we’ve included a table below exploring the 100 largest cities in the U.S. Whether you’re planning a move or simply looking to stay informed, you can use the table to compare risk level, population growth, and home value trends.
Methodology
In order to better understand the relationship between increasing natural disasters, population movement and home values, we gathered data on weather hazards from the NOAA National Centers for Environmental Information Storm Events Database and calculated the annual increase in weather hazards for almost all U.S. counties and the 100 biggest cities.
For further analysis, we wanted to classify cities as either high-risk, medium-risk or low-risk. To do this, we took the locations in the top 25% in regard to change in rate of weather hazards and made them high-risk. The bottom 25% were classified as low-risk, with the remaining middle 50% classified as medium-risk.
To analyze the impact of increasing weather hazards on the population, we used a similar method. Using U.S. Census Bureau data, we calculated the annual change in population, then calculated the average annual increase from 2010-2014 to the average annual increase from 2020-2024.
Lastly, we again used a similar process to test the impact of weather hazards on home values. We used historical average home value data from Zillow and then calculated the annual increase in home value.
Protect Your Home, Even in High-Risk Weather Areas
As extreme weather events become more common, having reliable home insurance is more important than ever. But solid coverage doesn’t have to come with a sky-high premium. Mercury offers affordable home insurance options that help safeguard your property from weather-related risks, so you can stay protected without stretching your budget.

The Mercury Marketing Team is made up of professionals in the fields of Content Creation, Public Relations, Social Media and Journalism. The team works together to deliver professionally written and researched content to provide information for consumers.