
For millions of Americans, driving is part of everyday life: the school drop-off, the morning commute, the late-night grocery run. But it’s also one of the riskiest things we do without thinking twice. And over the past decade, the safety of America’s roads has changed in ways many drivers might not expect.
To better understand these shifts, we analyzed 10 years of fatal crash data (2014–2023) from the National Highway Traffic Safety Administration (NHTSA) to identify where driver involvement in fatal crashes is increasing and where it’s declining. Using the agency’s Fatality Analysis Reporting System (FARS) and Fatality and Injury Reporting System Tool (FIRST), we compared the average number of people involved in fatal crashes across two key periods: 2014–2018 and 2019–2023.
The analysis reveals which roads and states across the country are becoming more dangerous, and where safety has improved over time. It further evaluates the impact of major construction and infrastructure projects by comparing fatal-crash involvement before and after significant roadway redesigns.
The findings reveal a mixed picture. Some highways are safer today thanks to smarter design and better traffic flow. But others have become far more dangerous as populations grow, speeds climb, and road systems struggle to keep up with change.
The States Where Roads Are Becoming More Dangerous
Over the past decade, involvement in fatal crashes has become more frequent in much of the country, with some states seeing sharper increases than others. Our data indicates that while road safety has improved in a few areas, many regions are trending in the opposite direction.
Nowhere is that shift clearer than in Arizona, where the average number of people involved in fatal crashes has risen 7% since 2014, the largest increase among states. As more people move in and new developments stretch across the desert, traffic has surged. Busy corridors like I-10 and I-17 are now packed with commuters, long-haul trucks, and tourists, a mix that’s made driving in the Grand Canyon State increasingly risky.
Close behind are South Carolina (+5%), Florida (+4%), Nevada (+4%), and Oregon (+4%). Each has seen steady population growth over the past decade, and with that expansion comes more vehicles, construction, and congestion, all factors that can make driving more hazardous.
Still, a handful of states have moved in the right direction. Hawaii leads the nation with a 3% decline in fatal-crash involvement. Lower speed limits, targeted safety campaigns, and shorter driving distances may all help keep its roads safer.
A handful of other states, including Mississippi and Alaska, have also seen small but meaningful improvements, each recording roughly a 1% decline in fatal-crash involvement.
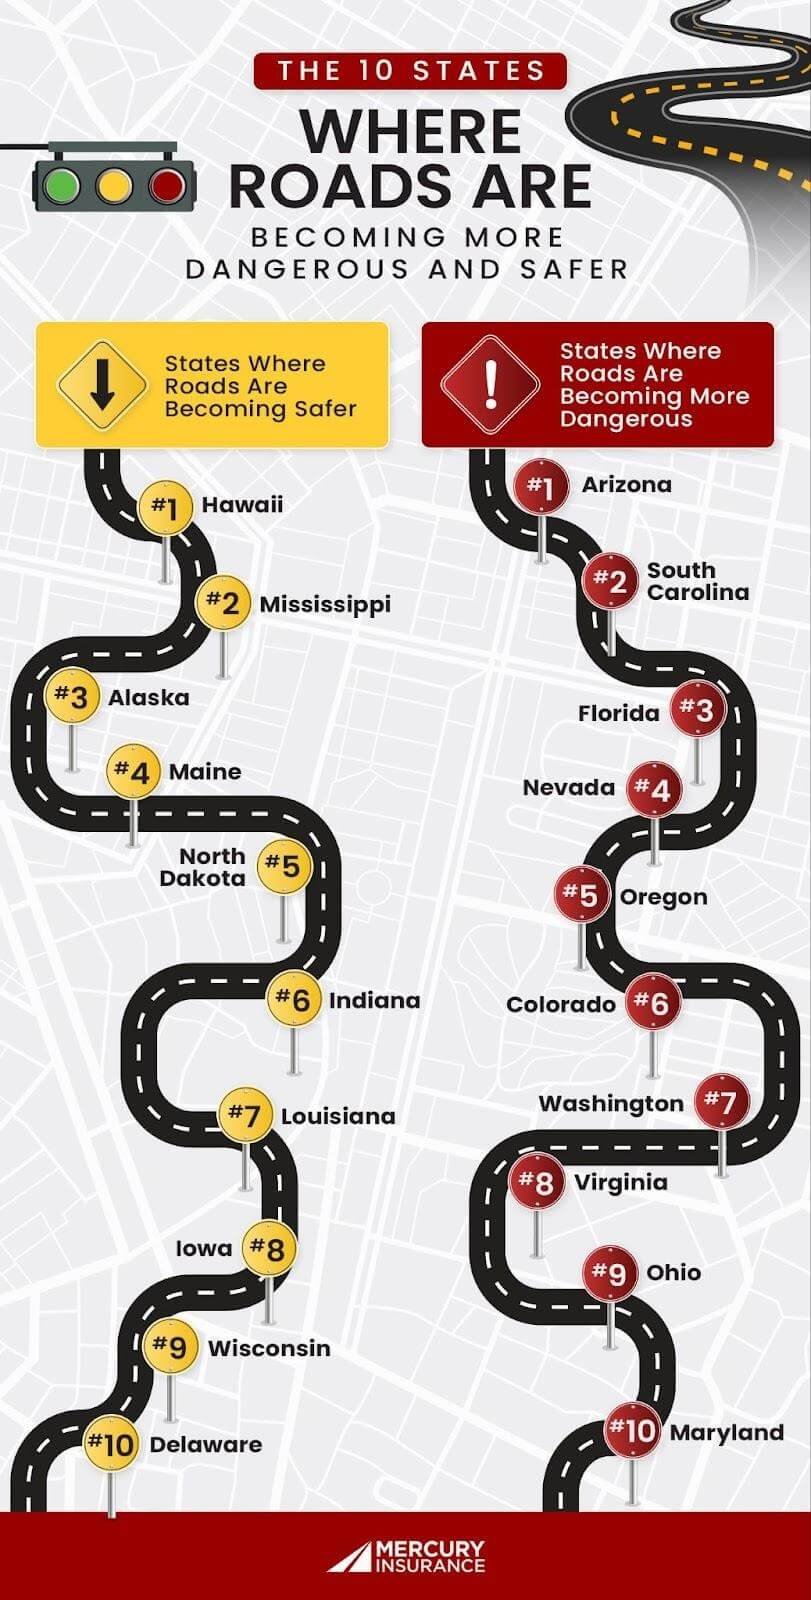
Top 5 States Where Roads Are Getting More Dangerous
- Arizona (+7%)
- South Carolina (+5%)
- Florida (+4%)
- Nevada (+4%)
- Oregon (+4%)
Top 5 States Where Roads Are Getting Safer
- Hawaii (−3%)
- Mississippi (−1%)
- Alaska (−1%)
- Maine (−1%)
- North Dakota (−1%)
The U.S. Roads Getting More Dangerous and Safer
If you’ve ever felt that some roads just feel more dangerous than others, you’re not wrong. Across the country, some stretches have seen fatal-crash involvement skyrocket, while others have become noticeably safer.
The most alarming trend comes from Texas, where the I-35W Tollway in Tarrant County saw a 2,660% increase in the average number of people involved in fatal crashes, the largest jump among the roads analyzed.
But the danger doesn’t stop there. Two major Pennsylvania interstates follow close behind: I-80 in Union County, where fatal-crash involvement is up 1,480%, and I-76 Mainline Turnpike in Westmoreland County, which has seen a 1,300% increase. Both highways cut through some of the state’s busiest corridors, carrying everyone from daily commuters to long-haul truckers.
In Lebanon County, Pennsylvania, the I-78 highway has gone the other way, seeing a 96% decline in fatal crash involvement. It’s one of the most dramatic safety turnarounds in the country, and the difference may point to the impact of targeted infrastructure upgrades and smarter road design.
Top 3 Roads Getting More Dangerous
- I-35W Tollway, Tarrant County, TX (+2,660%)
- I-80, Union County, PA (+1,480%)
- I-76 Mainline Turnpike, Westmoreland County, PA (+1,300%)
Top 3 Roads Getting Safer
- I-78, Lebanon County, PA (−96%)
- I-81, Schuylkill County, PA (−90%)
- Main St., Harrison County, MS (−91%)
The Construction Projects Making U.S. Roads More Dangerous and Safer
The goal of road construction is simple: improve traffic flow and keep drivers safe. But as the research indicates, not every project has delivered on that promise. In some areas, post-construction crash involvement increased, suggesting that even well-intentioned designs can introduce new risks.
In Virginia, for example, engineers redesigned the I-95 and Courthouse Road interchange into a diverging diamond, a layout meant to reduce risky left turns by shifting traffic to the opposite side of the road. Yet, in the five years after it opened, the average number of people involved in fatal crashes near the interchange rose by more than 1,100%.
Other projects show similar patterns. Along South Memorial Parkway in Alabama, fatal-crash involvement increased by 320% in the five years after completion, while Iowa’s US-20 four-lane expansion saw a 288% jump. These spikes often reflect how drivers adjust—or fail to adjust—to sudden changes in road design. New interchanges and shifting traffic patterns can cause confusion, speed misjudgment, and distraction—leading to serious crashes, especially on high-speed routes.
Still, the findings weren’t all negative. In Nevada, the US-95/CC-215 Centennial Bowl Interchange has achieved what it set out to do: Fatal-crash involvement fell 62% in the five years after completion, suggesting the redesign achieved its safety goals. Other bright spots include Florida’s I-295 West Beltway Express Lanes (-53%) and Washington’s I-5 HOV upgrades (-44%), where improved traffic flow appears to be making a real difference.
These figures reflect changes in fatal-crash involvement before and after construction, not proof that the projects themselves directly caused the increases.
Top 3 Projects Where Fatal-Crash Involvement Increased (5 Years Post-Completion)
- I-95/VA-630 Diverging Diamond (VA) (+1,140%)
- South Memorial Parkway Widening (AL) (+320%)
- US-20 Four-Lane Completion (IA) (+288%)
Top 3 Projects Where Fatal-Crash Involvement Decreased (5 Years Post-Completion)
- US-95/CC-215 Interchange Upgrades (NV) (−62%)
- I-295 West Beltway Express Lanes (FL) (−53%)
- I-5 M St. to Portland Ave HOV (WA) (−44%)
Helping Drivers Navigate a Changing Landscape
Every road tells a story, and not all of them end the same way. In some parts of the country, new designs and smart planning have made driving safer than ever. But in others, rapid growth and heavier traffic have made everyday routes more unpredictable and more dangerous.
The research highlights a growing challenge for transportation planners: balancing innovation with safety. As more states embrace new road designs and smart infrastructure, communities will need to monitor how those changes affect drivers. Progress means little if people don’t feel safe behind the wheel.
For drivers, the message is clear: stay informed, stay insured, and stay alert. Mercury Insurance helps drivers protect what matters most, offering affordable, reliable car insurance and car insurance quotes to keep you covered, no matter where the road leads.
Methodology
To find out where roads are becoming more or less dangerous, we analyzed 10 years of fatal crash data from the National Highway Traffic Safety Administration’s (NHTSA) Fatality Analysis Reporting System (FARS), covering 2014–2023. By comparing the average number of people involved in fatal crashes during two five-year periods — 2014–2018 and 2019–2023 — we identified which roads, counties, and states have seen the biggest changes in crash involvement over time. All percentages are rounded to the nearest whole number.
As part of the analysis, we also looked at how major construction and infrastructure projects may be affecting road safety. Using data from the NHTSA’s Fatality and Injury Reporting System Tool (FIRST), we compared the average number of people involved in fatal crashes in the five years before and five years after each selected project was completed. These projects were chosen for their size, visibility, and potential to impact driver behavior and traffic flow.
While this data highlights meaningful patterns, it doesn’t prove direct cause and effect. Factors like traffic volume, population growth, weather, or enforcement changes can also influence crash trends. Still, comparing pre- and post-construction averages helps reveal how infrastructure updates and roadway design changes may align with shifts in road safety across the U.S.

The Mercury Marketing Team is made up of professionals in the fields of Content Creation, Public Relations, Social Media and Journalism. The team works together to deliver professionally written and researched content to provide information for consumers.